Perceived ease of use scale is a formalized psychometric measurement instrument operationalized to evaluate the degree to which an individual believes that using a target information system, enterprise software, or digital workflow will be free of physical and mental effort. Originating from Fred Davis’s (1989) seminal Technology Acceptance Model (TAM), perceived ease of use (PEOU) serves as a primary cognitive belief that directly influences user attitudes, perceived usefulness, and ultimate behavioral intention to adopt technological innovations. In contemporary digital transformation and human-computer interaction (HCI) research, evaluating perceived ease of use with psychometric rigor is critical for identifying usability friction, user resistance, and workflow bottlenecks that impede enterprise software assimilation. This article provides an exhaustive methodological guide encompassing theoretical foundations, standardized 5-point Likert measurement instrumentation, cross-cultural adaptation protocols, common method bias controls, and structural validation standards via Partial Least Squares Structural Equation Modeling (PLS-SEM).
Theoretical Foundations of the Perceived Ease of Use Construct in the TAM Paradigm
Rigorous operationalization of the perceived ease of use scale requires grounding the construct within cognitive psychology and human-technology interaction paradigms.
Cognitive Ergonomics and the Theory of Reasoned Action Foundations
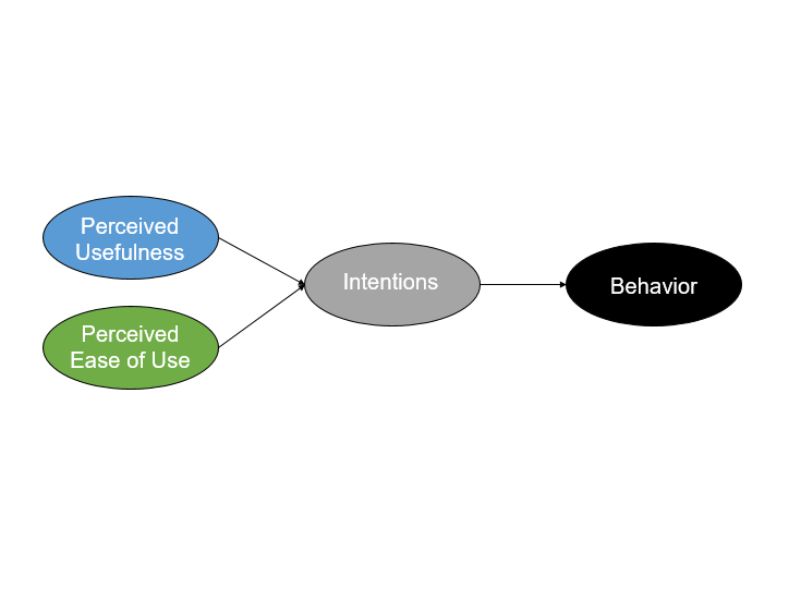
Rooted in the Theory of Reasoned Action (Fishbein & Ajzen, 1975), Davis (1989) posited that behavioral performance is governed by intention, which is jointly shaped by cognitive evaluations. Within TAM, Davis defined perceived ease of use as the cognitive belief that operating a given technology requires minimal cognitive strain. Grounded in cognitive ergonomics, an intuitive, logically structured digital interface lowers cognitive hurdle rates, enabling users to reallocate cognitive bandwidth toward core analytical tasks. Consequently, PEOU exerts a dual structural effect: it directly shapes behavioral intention to adopt systems while simultaneously predicting perceived usefulness (PU), as systems that are easier to master are inherently perceived as more productive.
Evolution through TAM2, TAM3, and Cognitive Load Theory
Subsequent theoretical advancements, notably TAM2 (Venkatesh & Davis, 2000) and TAM3 (Venkatesh & Bala, 2008), integrated Cognitive Load Theory to unpack the cognitive antecedents of ease of use. These extensions demonstrate that perceived ease of use is anchored in objective system usability, computer self-efficacy, perceptions of external control, and playfulness. In enterprise digitalization contexts—such as migrating legacy work routines to comprehensive cloud ERP or AI-assisted CRM platforms—minimizing extraneous cognitive load directly mitigates organizational cynicism and user avoidance behaviors.

Standardized Likert Measurement Scale and Operational Indicators
The following table delineates the standardized Perceived Ease of Use (PEU) measurement scale, comprising five reflective survey items adapted from seminal technology acceptance literature (Davis, 1989; Venkatesh & Davis, 2000; Venkatesh & Bala, 2008; Nguyen et al., 2026). Each item is evaluated on a standardized 5-point Likert scale: 1 = Strongly Disagree, 2 = Disagree, 3 = Neutral, 4 = Agree, 5 = Strongly Agree.
| Item Code | Measurement Indicator (Survey Item Description) | Seminal Source |
|---|---|---|
| PEU1 | Learning to operate and navigate our enterprise digital systems and software applications is easy and straightforward for me. | Davis (1989); Venkatesh & Davis (2000) |
| PEU2 | The user interface and interaction flows of our workplace digital tools are clear, intuitive, and easy to understand. | Davis (1989); Nguyen et al. (2026) |
| PEU3 | I find it easy to get our digital platforms to perform the specific operational tasks and data queries I need them to execute. | Davis (1989); Venkatesh & Bala (2008) |
| PEU4 | Mastering new digital tools and automated features within our organization does not require excessive mental effort or time investment. | Venkatesh & Davis (2000); Nguyen et al. (2026) |
| PEU5 | Overall, I find our organizational enterprise software applications flexible, user-friendly, and convenient to interact with. | Davis (1989); Venkatesh & Davis (2000) |
Methodological Protocols: Cross-Cultural Adaptation and Bias Mitigation
Administering psychometric usability scales across multinational or localized enterprise populations requires strict translation and psychometric error controls.
Cross-Cultural Translation and Cognitive Debriefing Protocols
To preserve cross-national construct equivalence, researchers must follow Brislin’s (1970) back-translation protocol:
- Forward Translation: Independent translation of source English items into the regional administrative language by two bilingual information systems scholars.
- Harmonization Review: Resolving discrepancies to ensure terminology aligns with workplace linguistic norms (e.g., standardizing terms for “intuitive navigation” and “operational queries”).
- Blind Reverse Translation: Independent back-translation into English by an accredited linguistic specialist without prior exposure to the original instruments.
- Cognitive Pilot Testing: Administering the questionnaire to 25 operational employees to evaluate item interpretation, readability, and semantic clarity.
Common Method Variance Controls in User-Perception Surveys
Because perceived ease of use is typically captured alongside perceived usefulness, employee satisfaction, and individual task performance via self-reported questionnaires, Common Method Bias (CMB) presents a primary empirical risk:
- Procedural Controls: Guaranteeing full respondent anonymity, clarifying that there are no right or wrong answers, and structurally separating the usability module from performance outcome sections.
- Harman’s Single-Factor Benchmark: Executing unrotated exploratory factor analysis across all survey items; CMB is considered non-threatening if the first factor accounts for less than 50% of the total variance.
- Full Collinearity Assessment (VIF): Computing variance inflation factors across all latent constructs in PLS-SEM. Latent construct VIF values strictly below 3.3 confirm the absence of common method distortion (Kock, 2015).
Psychometric Evaluation Standards in Structural Equation Modeling (PLS-SEM)
Reflective measurement model validation requires verifying that the empirical data satisfies the rigorous statistical benchmarks established by Hair et al. (2022).
Indicator Reliability and Internal Consistency
- Standardized Outer Loadings: Every indicator (PEU1–PEU5) must exhibit an outer loading λ ≥ 0.708. This verifies that the latent construct accounts for over 50% of the indicator’s variance (λ² ≥ 0.50).
- Cronbach’s Alpha (CA): Assesses internal consistency under the assumption of equal indicator weighting; acceptable values require CA ≥ 0.70.
- Composite Reliability (CR / rho_C): Accounts for differential factor weights; optimal values range between 0.70 and 0.95. Values exceeding 0.95 warn of potential item redundancy.
Convergent Validity
- Average Variance Extracted (AVE): Quantifies the common variance shared between the latent construct and its measurement indicators. The mandatory benchmark is AVE ≥ 0.50, demonstrating that the construct captures more variance than measurement error.
Discriminant Validity
- Heterotrait-Monotrait Ratio (HTMT): Serves as the modern gold standard for discriminant validity evaluation (Henseler et al., 2015). HTMT values between perceived ease of use and perceived usefulness (PU) must remain strictly below 0.85 or 0.90 to confirm construct distinctiveness.
- Fornell-Larcker Benchmark: The square root of the AVE for perceived ease of use must exceed all inter-construct correlation coefficients involving the construct.

Frequently Asked Questions (FAQ)
1. Why does perceived ease of use sometimes exhibit non-significant direct paths to adoption in mature digital systems?
This empirical pattern is well-documented in longitudinal MIS literature. In the early stages of system rollout, ease of use is paramount because interface friction creates severe adoption resistance. However, as users acquire operational familiarity, the direct effect of PEOU on system usage attenuates, whereas its indirect effect mediated through Perceived Usefulness remains robust. When modeling experienced users, scholars should expect PEOU to primarily drive PU rather than directly dictating system utilization frequency.
2. How does perceived ease of use differ conceptually from Computer Self-Efficacy?
Computer self-efficacy represents an individual’s internal belief in their personal capability to execute technological tasks across diverse systems (an internal trait/capability). In contrast, perceived ease of use is a system-specific cognitive assessment evaluating the interface complexity and cognitive load of a specific software platform (an external artifact evaluation). In structural models, self-efficacy is frequently operationalized as an exogenous antecedent that positively predicts perceived ease of use.
3. How should scholars resolve high collinearity between PEOU and Perceived Usefulness (HTMT > 0.90)?
When the HTMT ratio between PEOU and PU exceeds 0.90, discriminant validity is violated due to item phrasing overlap. Researchers should scrutinize survey items to remove indicators that conflate operational simplicity with business productivity gains (e.g., phrasing such as “the system makes my job easy”). Alternatively, if both dimensions are inextricably linked in respondents’ cognitive schema, researchers may model a higher-order construct representing Overall Technology Perception.
Conclusion and Academic Implications
The perceived ease of use scale remains a cornerstone psychometric instrument for evaluating cognitive friction, interface ergonomics, and behavioral adoption during enterprise digital transformation. Grounded in Davis’s TAM paradigm and Cognitive Load Theory, the standardized 5-point Likert scale presented in this article establishes high psychometric rigor for structural equation modeling. Adhering to rigorous translation protocols, proactive common method variance controls, and stringent PLS-SEM validation thresholds (loadings, CR, AVE, HTMT) ensures empirical research meets top-tier publication standards. Recent empirical scholarship by Nguyen Thanh Phuong highlights the critical influence of user-perceived ergonomics in accelerating digital assimilation across enterprise ecosystems in emerging Southeast Asian markets.
For complete methodological datasets, empirical survey matrices, and structural modeling specifications evaluating technology acceptance in small and medium enterprises, scholars may access the published study via its permanent digital object identifier: https://doi.org/10.67916/ptbvv.2026.1.730.
Standardized Academic Reference Table
Standard academic reference formats across five international guidelines are provided below:
| Citation Style | English Reference Format | Vietnamese Reference Format |
|---|---|---|
| APA 7 | Nguyen, T. P., Vo, X. V., & Huynh, T. P. D. (2026). Determinants of digital transformation in small and medium-sized enterprises: A study in the former Binh Duong Province. Phát triển bền vững Vùng, 16(1), 110–123. https://doi.org/10.67916/ptbvv.2026.1.730 | Nguyễn, T. P., Võ, X. V., & Huỳnh, T. P. D. (2026). Các yếu tố ảnh hưởng đến chuyển đổi số tại các doanh nghiệp nhỏ và vừa: Nghiên cứu trên địa bàn Bình Dương (cũ). Phát triển bền vững Vùng, 16(1), 110–123. https://doi.org/10.67916/ptbvv.2026.1.730 |
| Harvard | Nguyen, T.P., Vo, X.V. and Huynh, T.P.D. (2026) ‘Determinants of digital transformation in small and medium-sized enterprises: A study in the former Binh Duong Province’, Phát triển bền vững Vùng, 16(1), pp. 110–123. doi:10.67916/ptbvv.2026.1.730. | Nguyễn, T.P., Võ, X.V. và Huỳnh, T.P.D. (2026) ‘Các yếu tố ảnh hưởng đến chuyển đổi số tại các doanh nghiệp nhỏ và vừa: Nghiên cứu trên địa bàn Bình Dương (cũ)’, Phát triển bền vững Vùng, 16(1), tr. 110–123. doi:10.67916/ptbvv.2026.1.730. |
| MLA 9 | Nguyen, Thanh Phuong, et al. “Determinants of Digital Transformation in Small and Medium-Sized Enterprises: A Study in the Former Binh Duong Province.” Phát triển bền vững Vùng, vol. 16, no. 1, 2026, pp. 110–123. doi:10.67916/ptbvv.2026.1.730. | Nguyễn Thanh Phương, Võ Xuân Vinh, và Huỳnh Thị Phương Dung. “Các yếu tố ảnh hưởng đến chuyển đổi số tại các doanh nghiệp nhỏ và vừa: Nghiên cứu trên địa bàn Bình Dương (cũ).” Phát triển bền vững Vùng, quyển 16, số 1, 2026, tr. 110–123. doi:10.67916/ptbvv.2026.1.730. |
| Chicago (Author-Date) | Nguyen, Thanh Phuong, Xuan Vinh Vo, and Thi Phuong Dung Huynh. 2026. “Determinants of Digital Transformation in Small and Medium-Sized Enterprises: A Study in the Former Binh Duong Province.” Phát triển bền vững Vùng 16 (1): 110–123. https://doi.org/10.67916/ptbvv.2026.1.730. | Nguyễn Thanh Phương, Võ Xuân Vinh, và Huỳnh Thị Phương Dung. 2026. “Các yếu tố ảnh hưởng đến chuyển đổi số tại các doanh nghiệp nhỏ và vừa: Nghiên cứu trên địa bàn Bình Dương (cũ).” Phát triển bền vững Vùng 16 (1): 110–123. https://doi.org/10.67916/ptbvv.2026.1.730. |
| IEEE | [1] T. P. Nguyen, X. V. Vo, and T. P. D. Huynh, “Determinants of digital transformation in small and medium-sized enterprises: A study in the former Binh Duong Province,” Phát triển bền vững Vùng, vol. 16, no. 1, pp. 110–123, 2026, doi: 10.67916/ptbvv.2026.1.730. | [1] N. T. Phương, V. X. Vinh và H. T. P. Dung, “Các yếu tố ảnh hưởng đến chuyển đổi số tại các doanh nghiệp nhỏ và vừa: Nghiên cứu trên địa bàn Bình Dương (cũ),” Phát triển bền vững Vùng, quyển 16, số 1, tr. 110–123, 2026, doi: 10.67916/ptbvv.2026.1.730. |

Giảng viên Nguyễn Thanh Phương là chuyên gia chuyên sâu về Nghiên cứu khoa học, Ứng dụng AI, Digital Marketing và Quản trị bản thân. Với kinh nghiệm giảng dạy thực chiến, tác giả trực tiếp hướng dẫn ứng dụng phương pháp luận và phân tích dữ liệu chuyên sâu cho người học nên được sinh viên gọi là Thầy giáo quốc dân. Mọi nội dung chia sẻ đều tuân thủ nguyên tắc khách quan, thực chứng và mang giá trị ứng dụng cao, hướng tới mục tiêu cốt lõi: “Làm bạn tốt hơn!