Organizational culture scale is a standardized psychometric measurement instrument operationalized to quantify shared core values, behavioral norms, cognitive assumptions, and innovation climates that regulate collective action and technology assimilation within modern enterprises. In information systems, administrative science, and organizational sociology literature, establishing a valid culture scale is crucial for understanding why technologically identical systems produce profoundly divergent performance outcomes across organizations. An unsupportive, rigid, or risk-averse organizational culture creates severe organizational inertia, sabotaging technological adoption regardless of financial capital investment. This article provides an exhaustive methodological blueprint covering theoretical grounding, standardized 5-point Likert measurement items, cross-cultural translation protocols, common method bias controls, and measurement model evaluation guidelines using Partial Least Squares Structural Equation Modeling (PLS-SEM).

Theoretical Foundations of the Organizational Culture Construct in Digital Research
Establishing robust construct validity requires anchoring the organizational culture scale within foundational sociological and managerial paradigms.
Edgar Schein’s Tri-Level Model of Culture
Edgar Schein (1985, 2010) conceptualizes organizational culture across three interdependent levels: (1) Artifacts (visible structures, technological architecture, behavioral rituals); (2) Espoused Values (conscious strategies, goals, and organizational philosophies); and (3) Basic Underlying Assumptions (unconscious, taken-for-granted beliefs about reality, human nature, and work). In empirical quantitative research, measuring espoused values and observable behavioral norms offers the highest degree of construct reliability. The organizational culture scale must operationalize actionable dimensions: psychological safety, tolerance for experimental failure, and collaborative knowledge-exchange norms across operational boundaries.
The Competing Values Framework: Adhocracy and Digital Adaptability
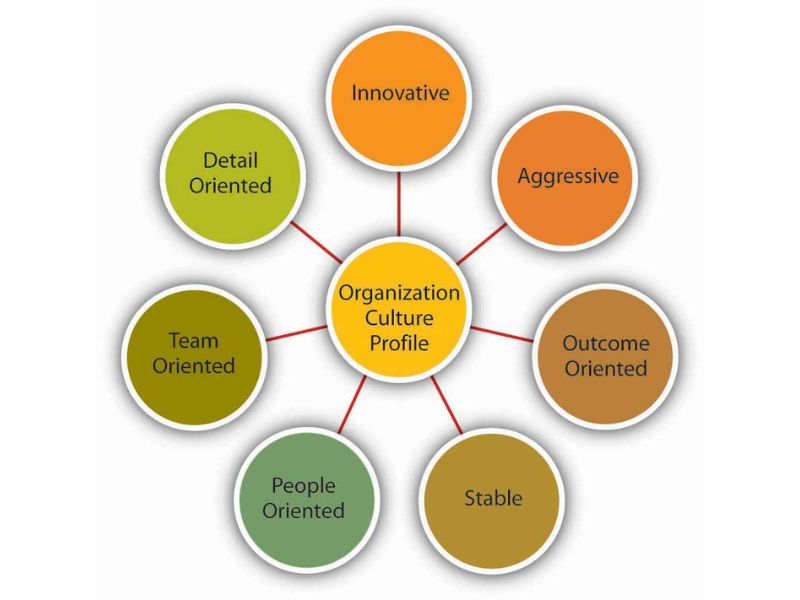
Cameron and Quinn’s (2006) Competing Values Framework (CVF) categorizes organizational culture along two structural axes: flexibility versus control, and internal focus versus external orientation. This yields four archetypes: Clan, Adhocracy, Market, and Hierarchy. In modern digital transformation literature, the Adhocracy culture—distinguished by entrepreneurial orientation, organic structural flexibility, experimentation, and dynamic adaptability—serves as the primary behavioral catalyst for technology absorption. Developing a scale centered on innovation and learning agility provides empirical scholars with a focused, parsimonious instrument to evaluate digital readiness.

Standardized Likert Measurement Scale and Operational Indicators
The following table delineates the standardized Organizational Culture (OCU) measurement scale, comprising five reflective survey items adapted from seminal organizational behavior and digital transformation literature (Cameron & Quinn, 2006; Schein, 2010; Al-Alawi et al., 2007; Tuan, 2021; Nguyen et al., 2026). Each item is evaluated on a standardized 5-point Likert scale: 1 = Strongly Disagree, 2 = Disagree, 3 = Neutral, 4 = Agree, 5 = Strongly Agree.
| Item Code | Measurement Indicator (Survey Item Description) | Seminal Source |
|---|---|---|
| OCU1 | Our enterprise fosters an open, forward-looking work climate that encourages employees to experiment with innovative technologies and workflows. | Cameron & Quinn (2006); Tuan (2021) |
| OCU2 | Our organization treats pilot project failures and operational setbacks during technology adoption as constructive learning opportunities. | Schein (2010); Nguyen et al. (2026) |
| OCU3 | Cross-departmental collaboration, mutual support, and transparent knowledge-sharing are deeply embedded in our daily operational routines. | Al-Alawi et al. (2007); Tuan (2021) |
| OCU4 | Employees at all organizational tiers are provided with direct access to enterprise data and actively participate in digital process-optimization decisions. | Cameron & Quinn (2006); Al-Alawi et al. (2007) |
| OCU5 | A commitment to continuous learning, digital upskilling, and intellectual agility is consistently shared and practiced across our entire workforce. | Schein (2010); Nguyen et al. (2026) |
Methodological Protocols: Cross-Cultural Adaptation and Bias Mitigation
Administering psychometric culture scales across diverse national and regional business contexts demands strict linguistic equivalence protocols and error controls.
Translation Protocols and Semantic Equivalence Verification
To ensure robust measurement equivalence across international survey settings, researchers must execute a systematic back-translation protocol (Brislin, 1970):
- Forward Translation: Independent translation from source English into the regional administrative language by two bilingual organizational behavior scholars.
- Harmonization Committee: Resolving conceptual ambiguities to match local corporate terminology (e.g., standardizing translations of “psychological safety” and “cross-functional collaboration”).
- Blind Reverse Translation: Independent back-translation into English by an accredited linguistic specialist without access to the original instrument.
- Cognitive Pilot Testing: Administering the questionnaire to 25 enterprise managers and operational personnel to evaluate item interpretation, readability, and social desirability pressures.
Procedural and Statistical Controls for Common Method Bias
Because culture scales capture perceptual beliefs alongside dependent organizational performance outcomes, Common Method Bias (CMB) presents a primary empirical risk:
- Procedural Controls: Guaranteeing full respondent anonymity, neutralizing survey item wording to reduce social desirability distortion, and structurally separating the culture module from outcome variable sections.
- Harman’s Single-Factor Benchmark: Executing unrotated exploratory factor analysis across all survey items; CMB is considered non-threatening if the first factor accounts for less than 50% of the total variance.
- Full Collinearity Assessment (VIF): Computing variance inflation factors across all latent constructs in PLS-SEM. Latent construct VIF values strictly below 3.3 confirm the absence of common method distortion (Kock, 2015).
Psychometric Evaluation Standards in Structural Equation Modeling (PLS-SEM)
Reflective measurement model validation requires verifying that the empirical data satisfies the rigorous statistical benchmarks established by Hair et al. (2022).
Indicator Reliability and Internal Consistency
- Standardized Outer Loadings: Every indicator (OCU1–OCU5) must exhibit an outer loading λ ≥ 0.708. This verifies that the latent construct accounts for over 50% of the indicator’s variance (λ² ≥ 0.50).
- Cronbach’s Alpha (CA): Assesses internal consistency under the assumption of equal indicator weighting; acceptable values require CA ≥ 0.70.
- Composite Reliability (CR / rho_C): Accounts for differential factor weights; optimal values range between 0.70 and 0.95. Values exceeding 0.95 warn of potential item redundancy.
Convergent Validity
- Average Variance Extracted (AVE): Quantifies the common variance shared between the latent construct and its measurement indicators. The mandatory benchmark is AVE ≥ 0.50, demonstrating that the construct captures more variance than measurement error.
Discriminant Validity
- Heterotrait-Monotrait Ratio (HTMT): Serves as the modern gold standard for discriminant validity evaluation (Henseler et al., 2015). HTMT values between organizational culture and all other latent constructs must remain strictly below 0.85 or 0.90.
- Fornell-Larcker Benchmark: The square root of the AVE for organizational culture must exceed all inter-construct correlation coefficients involving the construct.
Frequently Asked Questions (FAQ)
1. Should organizational culture be operationalized as an exogenous antecedent or a moderating mechanism?
Both structural specifications are conceptually valid depending on theoretical framing. When investigating technology adoption drivers, culture is typically specified as an exogenous antecedent that directly fosters digital capability development and top management commitment. Conversely, when investigating technology value realization, culture is frequently modeled as a moderating variable: an adaptive, innovative culture significantly amplifies the positive impact of digital infrastructure investments on firm financial and operational performance.
2. Can organizational culture be accurately measured using perceptual self-reported survey data?
Yes. Perceptual survey measurement is the dominant methodological paradigm in organizational sociology and management science because shared perceptions constitute the psychological climate that governs workplace behavior. To enhance empirical robustness, scholars frequently employ aggregated team-level designs or triangulate survey data with qualitative ethnographic observations and internal policy documentation.
3. How should researchers address cultural differences when surveying multinational enterprises?
When surveying multinational enterprises or cross-border subsidiaries, researchers must test for Measurement Invariance of Composite Models (MICOM) in PLS-SEM. Establishing configurational and compositional invariance ensures that observed differences in path coefficients stem from true structural relationships rather than divergent cultural interpretations of survey items.
Conclusion and Academic Implications
Developing a psychometrically robust organizational culture scale provides management and information systems scholars with an empirical instrument to quantify the social and behavioral foundations of digital transformation. Grounded in Schein’s cultural levels and the Competing Values Framework, the standardized 5-point Likert scale presented in this article establishes high reliability and validity for structural equation modeling. Adhering to rigorous translation protocols, proactive common method variance controls, and stringent PLS-SEM validation thresholds (loadings, CR, AVE, HTMT) ensures empirical research meets top-tier publication standards. Recent empirical scholarship by Nguyen Thanh Phuong underscores the decisive role of an innovation-oriented culture in enabling sustainable technology assimilation across industrial enterprises in emerging markets.
For complete methodological matrices, empirical survey datasets, and structural modeling specifications evaluating organizational culture and technology adoption in emerging market enterprises, scholars are encouraged to review the published study via its permanent DOI: https://doi.org/10.67916/ptbvv.2026.1.730.
Standard academic reference formats across five international guidelines are provided below:
| Citation Style | English Reference Format | Vietnamese Reference Format |
|---|---|---|
| APA 7 | Nguyen, T. P., Vo, X. V., & Huynh, T. P. D. (2026). Determinants of digital transformation in small and medium-sized enterprises: A study in the former Binh Duong Province. Phát triển bền vững Vùng, 16(1), 110–123. https://doi.org/10.67916/ptbvv.2026.1.730 | Nguyễn, T. P., Võ, X. V., & Huỳnh, T. P. D. (2026). Các yếu tố ảnh hưởng đến chuyển đổi số tại các doanh nghiệp nhỏ và vừa: Nghiên cứu trên địa bàn Bình Dương (cũ). Phát triển bền vững Vùng, 16(1), 110–123. https://doi.org/10.67916/ptbvv.2026.1.730 |
| Harvard | Nguyen, T.P., Vo, X.V. and Huynh, T.P.D. (2026) ‘Determinants of digital transformation in small and medium-sized enterprises: A study in the former Binh Duong Province’, Phát triển bền vững Vùng, 16(1), pp. 110–123. doi:10.67916/ptbvv.2026.1.730. | Nguyễn, T.P., Võ, X.V. và Huỳnh, T.P.D. (2026) ‘Các yếu tố ảnh hưởng đến chuyển đổi số tại các doanh nghiệp nhỏ và vừa: Nghiên cứu trên địa bàn Bình Dương (cũ)’, Phát triển bền vững Vùng, 16(1), tr. 110–123. doi:10.67916/ptbvv.2026.1.730. |
| MLA 9 | Nguyen, Thanh Phuong, et al. “Determinants of Digital Transformation in Small and Medium-Sized Enterprises: A Study in the Former Binh Duong Province.” Phát triển bền vững Vùng, vol. 16, no. 1, 2026, pp. 110–123. doi:10.67916/ptbvv.2026.1.730. | Nguyễn Thanh Phương, Võ Xuân Vinh, và Huỳnh Thị Phương Dung. “Các yếu tố ảnh hưởng đến chuyển đổi số tại các doanh nghiệp nhỏ và vừa: Nghiên cứu trên địa bàn Bình Dương (cũ).” Phát triển bền vững Vùng, quyển 16, số 1, 2026, tr. 110–123. doi:10.67916/ptbvv.2026.1.730. |
| Chicago (Author-Date) | Nguyen, Thanh Phuong, Xuan Vinh Vo, and Thi Phuong Dung Huynh. 2026. “Determinants of Digital Transformation in Small and Medium-Sized Enterprises: A Study in the Former Binh Duong Province.” Phát triển bền vững Vùng 16 (1): 110–123. https://doi.org/10.67916/ptbvv.2026.1.730. | Nguyễn Thanh Phương, Võ Xuân Vinh, và Huỳnh Thị Phương Dung. 2026. “Các yếu tố ảnh hưởng đến chuyển đổi số tại các doanh nghiệp nhỏ và vừa: Nghiên cứu trên địa bàn Bình Dương (cũ).” Phát triển bền vững Vùng 16 (1): 110–123. https://doi.org/10.67916/ptbvv.2026.1.730. |
| IEEE | [1] T. P. Nguyen, X. V. Vo, and T. P. D. Huynh, “Determinants of digital transformation in small and medium-sized enterprises: A study in the former Binh Duong Province,” Phát triển bền vững Vùng, vol. 16, no. 1, pp. 110–123, 2026, doi: 10.67916/ptbvv.2026.1.730. | [1] N. T. Phương, V. X. Vinh và H. T. P. Dung, “Các yếu tố ảnh hưởng đến chuyển đổi số tại các doanh nghiệp nhỏ và vừa: Nghiên cứu trên địa bàn Bình Dương (cũ),” Phát triển bền vững Vùng, quyển 16, số 1, tr. 110–123, 2026, doi: 10.67916/ptbvv.2026.1.730. |

Giảng viên Nguyễn Thanh Phương là chuyên gia chuyên sâu về Nghiên cứu khoa học, Ứng dụng AI, Digital Marketing và Quản trị bản thân. Với kinh nghiệm giảng dạy thực chiến, tác giả trực tiếp hướng dẫn ứng dụng phương pháp luận và phân tích dữ liệu chuyên sâu cho người học nên được sinh viên gọi là Thầy giáo quốc dân. Mọi nội dung chia sẻ đều tuân thủ nguyên tắc khách quan, thực chứng và mang giá trị ứng dụng cao, hướng tới mục tiêu cốt lõi: “Làm bạn tốt hơn!