Báo cáo kết quả PLS-SEM là quy trình hệ thống hóa các bằng chứng thống kê nhằm chứng minh độ tin cậy (reliability) và tính giá trị (validity) của mô hình nghiên cứu trước khi đưa ra các kết luận về mối quan hệ giữa các biến số. Vấn đề cốt lõi mà giới hàn lâm đang gặp phải là việc áp dụng các tiêu chuẩn của CB-SEM (như AMOS) sang PLS-SEM một cách máy móc, hoặc bỏ qua việc đánh giá khả năng dự báo. Giải pháp chuẩn mực nhất hiện nay là tuân thủ nghiêm ngặt quy trình hai giai đoạn theo hướng dẫn của Hair et al. (2019), tập trung vào các tiêu chuẩn hiện đại như HTMT, PA và PLSpredict.

1. Tổng Quan & Lý Thuyết Nền Tảng (Overview & Theoretical Foundations)
1.1 Thông tin định danh bài báo
Để đảm bảo sự minh bạch và tính chính danh trong trích dẫn (citation), dưới đây là thông tin thư mục chuẩn APA của bài báo nền tảng được phân tích trong bài viết này:
- Tiêu đề gốc: When to use and how to report the results of PLS-SEM.
- Tiêu đề dịch: Khi nào nên sử dụng và cách báo cáo kết quả của mô hình cấu trúc tuyến tính bình phương tối thiểu riêng phần.
- Tác giả: Joseph F. Hair, Jeffrey J. Risher, Marko Sarstedt, Christian M. Ringle.
- Tạp chí: European Business Review, Vol. 31 No. 1, pp. 2-24 (2019).
1.2 Bối cảnh thực tiễn & Khoảng trống nghiên cứu
Trong giai đoạn trước năm 2010, CB-SEM (Covariance-based SEM) thống trị các nghiên cứu định lượng. Tuy nhiên, sự phức tạp của dữ liệu thực tế (dữ liệu phi chuẩn, mẫu nhỏ, mô hình phức tạp) đã thúc đẩy sự phổ biến của PLS-SEM. Mặc dù vậy, một khoảng trống lớn xuất hiện: Sự thiếu nhất quán trong báo cáo. Nhiều nhà nghiên cứu sử dụng PLS-SEM nhưng lại báo cáo các chỉ số phù hợp mô hình (Goodness-of-fit) của CB-SEM (như CFI, TLI, RMSEA) – điều vốn không phù hợp với bản chất của PLS. Bài báo của Hair et al. (2019) ra đời như một tiêu chuẩn để chấn chỉnh lại thực trạng này.
1.3 Hệ thống Lý thuyết nền tảng (Theoretical Foundations)
Để hiểu đúng về PLS-SEM, nhà nghiên cứu cần nắm vững bản chất khác biệt của nó so với CB-SEM:
- Phương pháp tiếp cận: PLS-SEM là phương pháp dựa trên biến tổng hợp (Composite-based). Nó tạo ra các biến tiềm ẩn bằng cách tổ hợp tuyến tính các biến quan sát, thay vì xem biến quan sát là kết quả phản ánh từ biến tiềm ẩn như CB-SEM (Common factor-based).
- Mục tiêu tối thượng: Trong khi CB-SEM tối thiểu hóa sự khác biệt giữa ma trận hiệp phương sai lý thuyết và thực tế (Theory Confirmation), thì PLS-SEM tối đa hóa phương sai giải thích được ($R^2$) của các biến nội sinh (Prediction-oriented).
- Hệ quả: Vì tập trung vào dự báo, các chỉ số đánh giá của PLS-SEM phải xoay quanh khả năng giải thích và dự báo, chứ không phải sự phù hợp tổng thể.

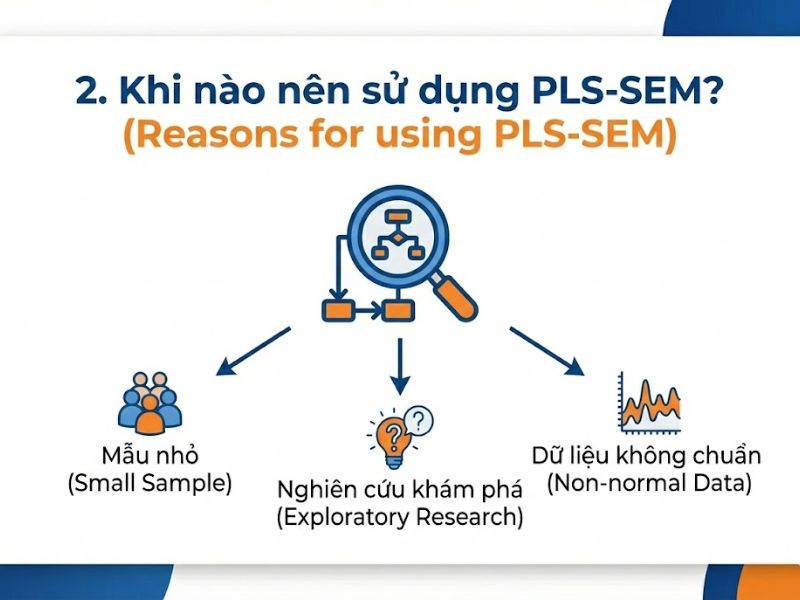
2. Khi nào nên sử dụng PLS-SEM? (Reasons for using PLS-SEM)
Việc lựa chọn phương pháp phân tích không được tùy tiện. Hair et al. (2019) cung cấp các luận cứ khoa học để bạn bảo vệ sự lựa chọn của mình trong phần “Phương pháp nghiên cứu” (Methodology) của luận văn/bài báo:
- Mục tiêu nghiên cứu thiên về dự báo: Nếu câu hỏi nghiên cứu của bạn là “Yếu tố nào dự báo tốt nhất hành vi của khách thể nghiên cứu (ví dụ: người tiêu dùng, nhân viên)?” hoặc “Mở rộng lý thuyết hiện có”, PLS-SEM là lựa chọn tối ưu.
- Độ phức tạp của mô hình: PLS-SEM xử lý rất tốt các mô hình có nhiều biến tiềm ẩn, nhiều đường dẫn (path relationships) và cấu trúc nhiều cấp (higher-order constructs) mà không gặp vấn đề về hội tụ (convergence issues) như CB-SEM.
- Sự hiện diện của biến nguyên nhân (Formative constructs): Đây là điểm mạnh tuyệt đối của PLS-SEM. CB-SEM gặp rất nhiều khó khăn và ràng buộc khi xử lý các thang đo nguyên nhân, trong khi PLS-SEM xử lý chúng một cách tự nhiên.
- Đặc điểm dữ liệu:
- Phân phối không chuẩn: PLS-SEM là phương pháp phi tham số (non-parametric), không yêu cầu dữ liệu phải phân phối chuẩn đa biến.
- Cỡ mẫu: Dù PLS-SEM hoạt động được với mẫu nhỏ, nhưng cần hiểu đúng: “Mẫu nhỏ” phải đảm bảo đủ độ mạnh thống kê (Statistical Power) chứ không phải mẫu nhỏ tùy ý.
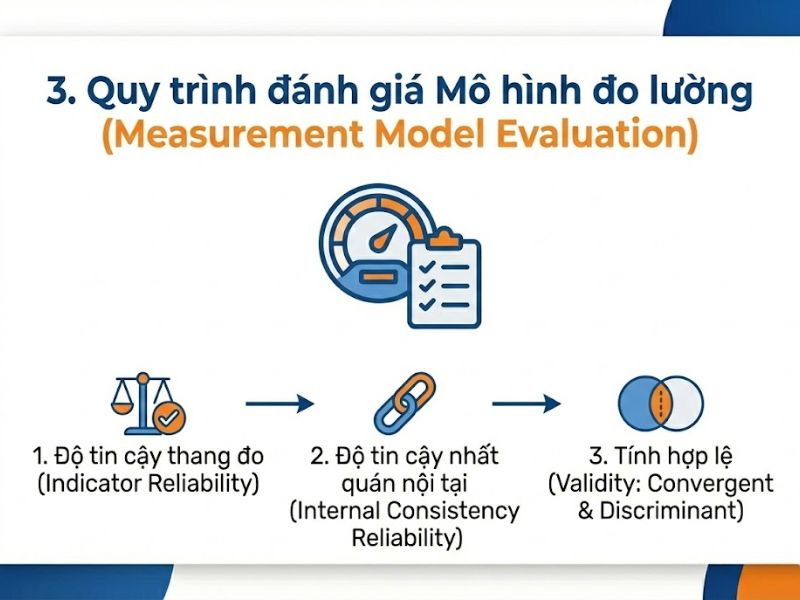
3. Quy trình đánh giá Mô hình đo lường (Measurement Model Evaluation)
Đây là bước quan trọng nhất. Nếu công cụ đo lường sai (Mô hình đo lường không đạt), kết quả kiểm định giả thuyết (Mô hình cấu trúc) sẽ vô nghĩa. Chúng ta cần phân biệt rạch ròi hai loại mô hình đo lường:
3.1 Đánh giá Mô hình Kết quả (Reflective Measurement Models)
Mô hình kết quả giả định rằng biến tiềm ẩn là nguyên nhân gây ra sự thay đổi của các biến quan sát. Các biến quan sát có tương quan chặt chẽ với nhau.
Bước 1: Độ tin cậy của biến quan sát (Indicator Reliability)
- Thao tác: Kiểm tra hệ số tải ngoài (Outer Loadings).
- Ngưỡng khoa học: ge 0.708.
- Lý giải chuyên sâu: Tại sao lại là con số lẻ 0.708? Vì bình phương của nó (0.708^2 \approx 0.50). Điều này có nghĩa là biến tiềm ẩn giải thích được hơn 50% phương sai của biến quan sát đó. Phần còn lại là sai số đo lường.
- Xử lý biến có loading thấp (0.40 – 0.70): Không xóa ngay lập tức. Chỉ xóa khi việc xóa giúp tăng độ tin cậy tổng hợp (CR) hoặc tính hội tụ (AVE) lên mức đạt chuẩn.
Bước 2: Độ tin cậy nhất quán nội tại (Internal Consistency Reliability)
- Cronbach’s Alpha: Thường đánh giá thấp độ tin cậy thực tế (conservative).
- Composite Reliability (CR): Thường đánh giá cao độ tin cậy (liberal).
- Rho_A (rho_A): Chỉ số tối ưu nhất, nằm giữa Alpha và CR.
- Yêu cầu: Các chỉ số này nên nằm trong khoảng 0.70 – 0.95. Nếu > 0.95, có thể các biến quan sát đang bị trùng lắp nội dung (redundant), làm giảm giá trị nội dung (content validity).
Bước 3: Tính giá trị hội tụ (Convergent Validity)
- Chỉ số: AVE (Average Variance Extracted).
- Ngưỡng: AVE $\ge 0.50$.
- Ý nghĩa: Tính trung bình, biến tiềm ẩn phải giải thích được hơn một nửa phương sai của các biến quan sát thuộc về nó.
Bước 4: Tính giá trị phân biệt (Discriminant Validity)
- Vấn đề: Tiêu chuẩn cũ Fornell-Larcker thường thất bại trong việc phát hiện sự thiếu phân biệt.
- Giải pháp: Sử dụng chỉ số HTMT (Heterotrait-Monotrait Ratio). Bản chất HTMT là tỷ lệ giữa trung bình tương quan giữa các biến khác nhóm chia cho trung bình tương quan giữa các biến cùng nhóm.
- Ngưỡng:
- HTMT < 0.85$ (Tiêu chuẩn khắt khe – cho các khái niệm hoàn toàn khác nhau).
- HTMT < 0.90$ (Tiêu chuẩn nới lỏng – cho các khái niệm có sự tương đồng về lý thuyết).
- Kiểm định Bootstrap: Khoảng tin cậy CI của HTMT không được chứa giá trị 1.
3.2 Đánh giá Mô hình Nguyên nhân (Formative Measurement Models)
Mô hình nguyên nhân giả định các biến quan sát tạo thành biến tiềm ẩn. Các biến này không nhất thiết phải tương quan với nhau (ví dụ: Chỉ số hài lòng cuộc sống được tạo thành từ Sức khỏe, Tài chính, Tình yêu – 3 biến này có thể không liên quan).
- Tính hội tụ (Convergent Validity): Thực hiện Phân tích dư thừa (Redundancy Analysis). Biến nguyên nhân phải tương quan mạnh (ge 0.70) với một biến đơn (single-item construct) đo lường cùng khái niệm đó.
- Đa cộng tuyến (Collinearity): Vì các biến nguyên nhân đi vào biến tiềm ẩn giống như hồi quy đa biến, đa cộng tuyến cao sẽ làm sai lệch trọng số. Yêu cầu VIF < 3 (hoặc tối đa < 5).
- Trọng số (Outer Weights):
- Kiểm tra ý nghĩa thống kê của Weights (sử dụng Bootstrapping).
- Nếu Weight có ý nghĩa (p < 0.05) -> Giữ lại.
- Nếu Weight không có ý nghĩa -> Kiểm tra Loading.
- Loading cao (ge 0.50) -> Giữ lại (nhưng xem xét ý nghĩa lý thuyết).
- Loading thấp (< 0.50) -> Có thể loại bỏ.
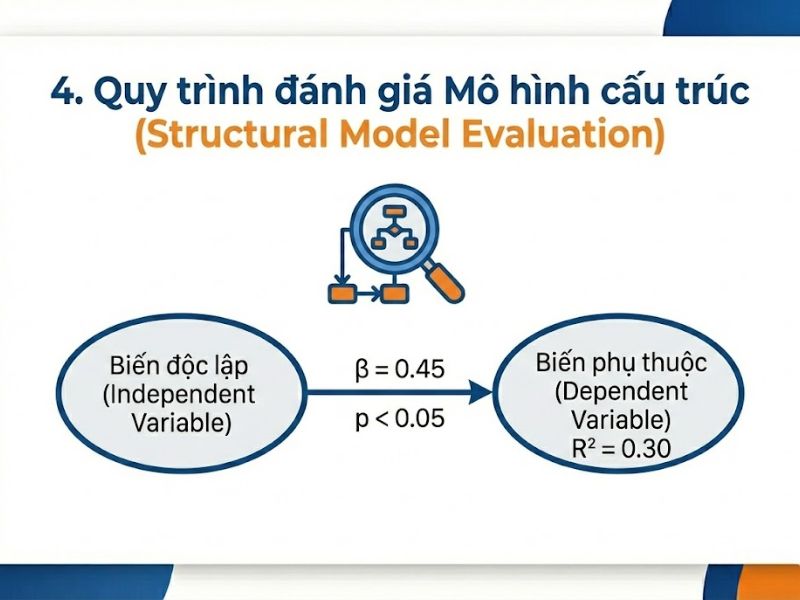
4. Quy trình đánh giá Mô hình cấu trúc (Structural Model Evaluation)
Sau khi khẳng định thang đo đạt chuẩn, ta mới tiến hành kiểm định giả thuyết. Quy trình báo cáo kết quả PLS-SEM cho phần này gồm 5 bước:
Bước 1: Kiểm tra Đa cộng tuyến cấu trúc (Lateral Collinearity)
Trước khi xem xét các tác động, phải đảm bảo các biến độc lập không tương quan quá mạnh với nhau. Kiểm tra VIF nội sinh (Inner VIF values). Ngưỡng chuẩn: VIF < 3.
Bước 2: Hệ số đường dẫn (Path Coefficients)
Đây là kết quả quan trọng nhất để trả lời câu hỏi nghiên cứu.
- Sử dụng Bootstrapping (5,000 – 10,000 mẫu lặp) để tính toán mức ý nghĩa ($p$-value) và khoảng tin cậy (Confidence Intervals).
- Lưu ý: Báo cáo cả ý nghĩa thống kê (statistical significance) và ý nghĩa thực tiễn (relevance). Một tác động nhỏ (0.1) có thể có ý nghĩa thống kê nhưng ít ý nghĩa quản trị.
Bước 3: Hệ số xác định (R^2)
R^2 biểu thị tổng phương sai của biến phụ thuộc được giải thích bởi các biến độc lập.
- Đánh giá:
- 0.75: Đáng kể (Substantial).
- 0.50: Trung bình (Moderate).
- 0.25: Yếu (Weak).
- Lưu ý: $R^2$ càng nhiều biến độc lập càng tăng, nên cần cẩn trọng khi so sánh các mô hình khác nhau.
Bước 4: Kích thước tác động (f^2)
Chỉ số này cho biết nếu loại bỏ một biến độc lập ra khỏi mô hình, thì $R^2$ sẽ giảm đi bao nhiêu. Nó đo lường “sức mạnh thực sự” của từng biến độc lập.
- Ngưỡng Cohen (1988): 0.02 (Nhỏ), 0.15 (Trung bình), 0.35 (Lớn). Nếu $f^2 < 0.02$, tác động đó được xem là không đáng kể, dù có ý nghĩa thống kê.
Bước 5: Khả năng dự báo (Q^2 và PLSpredict)
- Q^2 (Blindfolding): Dựa trên kỹ thuật tái lấy mẫu, tính toán khả năng phục hồi dữ liệu bị thiếu. Q^2 > 0 là yêu cầu bắt buộc.
- PLSpredict (Điểm nhấn của Hair et al. 2019): Đây là kỹ thuật phân chia mẫu (Train/Test split) để kiểm tra khả năng dự báo trên dữ liệu chưa biết (out-of-sample prediction).
- So sánh sai số RMSE của mô hình PLS với mô hình hồi quy tuyến tính ngây thơ (LM benchmark).
- Kết luận mạnh nhất: Nếu $RMSE_{PLS} < RMSE_{LM}$ cho tất cả các chỉ báo -> Mô hình có khả năng dự báo cao.
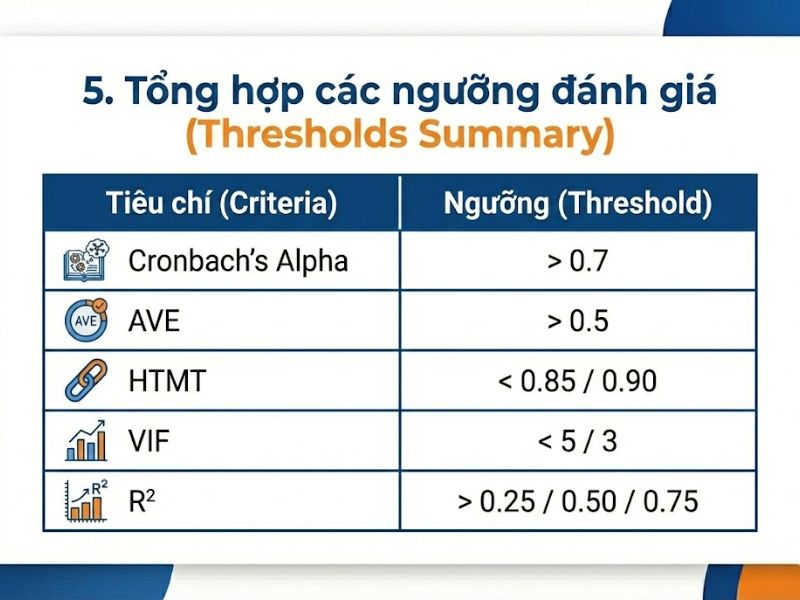
5. Tổng hợp các ngưỡng đánh giá (Thresholds Summary)
Bảng dữ liệu cấu trúc này tổng hợp toàn bộ các tiêu chí cần thiết để bạn đưa vào Chương 3 hoặc Chương 4 của luận văn.
| Giai đoạn đánh giá | Tiêu chí (Criterion) | Chỉ số (Metric) | Ngưỡng tham chiếu (Thresholds) | Nguồn trích dẫn |
| 1. Mô hình đo lường (Kết quả) | Độ tin cậy biến quan sát | Outer Loadings | >= 0.708 (Tốt nhất) 0.40 – 0.70 (Cân nhắc xóa) | Hair et al. (2019) |
| Độ tin cậy nhất quán | Cronbach’s Alpha rho_A Composite Reliability (CR) | 0.70 – 0.95 | Hair et al. (2019) | |
| Tính giá trị hội tụ | AVE | >= 0.50 | Hair et al. (2019) | |
| Tính giá trị phân biệt | HTMT | < 0.85 (Khắt khe) < 0.90 (Thỏa hiệp) | Henseler et al. (2015) | |
| 2. Mô hình cấu trúc | Đa cộng tuyến | Inner VIF | < 3 (Lý tưởng) < 5 (Chấp nhận) | Hair et al. (2019) |
| Sức mạnh giải thích | R^2 | 0.75 (Cao); 0.50 (TB); $0.25$ (Yếu) | Hair et al. (2011) | |
| Kích thước tác động | f^2 | 0.02 (Nhỏ); 0.15 (TB); $0.35$ (Lớn) | Cohen (1988) | |
| Khả năng dự báo | Q^2 | > 0 | Geisser (1974) | |
| Sức mạnh dự báo ngoài mẫu | PLSpredict (RMSE) | RMSE_{PLS} < RMSE_{LM} (cho đa số biến) | Shmueli et al. (2016) |
6. Hướng Dẫn Ứng Dụng Nghiên Cứu (Academic Implications)
Đây là phần hướng dẫn chi tiết cho các bạn khi viết bài. Hãy viết có chiến lược:
- Chiến lược biện minh: Khi viết phần giới thiệu phương pháp, hãy viết: “Nghiên cứu này sử dụng PLS-SEM không chỉ vì kích thước mẫu giới hạn, mà quan trọng hơn là mục tiêu tối đa hóa khả năng dự báo biến mục tiêu [Tên biến Y] và sự phù hợp với mô hình phức tạp bao gồm các cấu trúc bậc hai…”. Điều này cho thấy bạn hiểu sâu sắc lý thuyết của Hair.
- Chiến lược trình bày:
- Sử dụng bảng biểu để tổng hợp kết quả (không viết văn xuôi liệt kê các con số).
- Đối với tính phân biệt, hãy mạnh dạn tuyên bố: “Thay vì sử dụng tiêu chuẩn Fornell-Larcker truyền thống vốn có độ nhạy thấp, nghiên cứu này sử dụng tiêu chuẩn HTMT (Henseler et al., 2015) để đảm bảo tính phân biệt chặt chẽ hơn”.
- Chiến lược thảo luận: Khi bàn về kết quả R^2, đừng chỉ nói cao hay thấp. Hãy so sánh nó với các nghiên cứu trước trong cùng lĩnh vực để thấy sự đóng góp của bạn.
7. Các Câu Hỏi Thường Gặp (FAQ)
Nếu R^2 của tôi thấp (ví dụ 0.15), liệu nghiên cứu có bị bác bỏ không?
Không hẳn. Trong các nghiên cứu hành vi xã hội phức tạp, $R^2$ thấp là chuyện bình thường. Quan trọng là bạn kiểm tra $f^2$ và ý nghĩa thống kê của các đường dẫn. Nếu các tác động là có thật và logic về mặt lý thuyết, kết quả vẫn có giá trị. Tuy nhiên, khả năng dự báo của mô hình sẽ bị hạn chế.
Tại sao SmartPLS tính ra HTMT lớn hơn 1?
Điều này là dấu hiệu cảnh báo nghiêm trọng rằng hai khái niệm của bạn đang bị trùng lặp hoàn toàn về mặt nội dung (thiếu tính phân biệt). Bạn cần gộp hai biến này làm một hoặc loại bỏ các câu hỏi (items) gây nhiễu chéo giữa hai biến.
Tôi có bắt buộc phải chạy PLSpredict không?
Nếu bạn muốn đăng bài trên các tạp chí hạng A (Q1, SSCI) hoặc muốn luận án đạt điểm xuất sắc, câu trả lời là CÓ. Đây là xu hướng bắt buộc của PLS-SEM hiện đại theo khuyến nghị của Hair et al. (2019). Nếu chỉ dừng lại ở luận văn thạc sĩ thông thường, $Q^2$ có thể là đủ.
8. Tài Liệu Tham Khảo (References)
Aguirre-Urreta, M.I. and Rönkkö, M. (2018), “Statistical inference with PLSc using bootstrap confidence intervals”, MIS Quarterly, Vol. 42 No. 3, pp. 1001-1020.
Akter, S., Fosso Wamba, S. and Dewan, S. (2017), “Why PLS-SEM is suitable for complex modelling? An empirical illustration in big data analytics quality”, Production Planning and Control, Vol. 28 Nos 11/12, pp. 1011-1021.
Ali, F., Rasoolimanesh, S.M. and Cobanoglu, C. (2018a), Applying Partial Least Squares in Tourism and Hospitality Research, Emerald, Bingley.
Ali, F., Rasoolimanesh, S.M., Sarstedt, M., Ringle, C.M. and Ryu, K. (2018b), “An assessment of the use of partial least squares structural equation modeling (PLS-SEM) in hospitality research”, International Journal of Contemporary Hospitality Management, Vol. 30 No. 1, pp. 514-538.
Avkiran, N.K. and Ringle, C.M. (2018), Partial Least Squares Structural Equation Modeling: Recent Advances in Banking and Finance, Springer International Publishing, Cham.
Bascle, G. (2008), “Controlling for endogeneity with instrumental variables in strategic management research”, Strategic Organization, Vol. 6 No. 3, pp. 285-327.
Becker, J.-M., Ringle, C.M. and Sarstedt, M. (2018), “Estimating moderating effects in PLS-SEM and PLSc-SEM: interaction term generation data treatment”, Journal of Applied Structural Equation Modeling, Vol. 2 No. 2, pp. 1-21.
Becker, J.-M., Rai, A., Ringle, C.M. and Völckner, F. (2013), “Discovering unobserved heterogeneity in structural equation models to avert validity threats”, MIS Quarterly, Vol. 37 No. 3, pp. 665-694.
Becker, J.-M., Ringle, C.M., Sarstedt, M. and Völckner, F. (2015), “How collinearity affects mixture regression results”, Marketing Letters, Vol. 26 No. 4, pp. 643-659.
Bollen, K.A. and Ting, K.-F. (2000), “A tetrad test for causal indicators”, Psychological Methods, Vol. 5 No. 1, pp. 3-22.
Boomsma, A. and Hoogland, J.J., (2001), “The robustness of LISREL modeling revisited”, in Cudeck, R., du Toit, S. and Sörbom, D. (Eds) Structural Equation Modeling: Present and Future, Scientific Software International, Chicago. 139-168.
Cenfetelli, R.T. and Bassellier, G. (2009), “Interpretation of formative measurement in information systems research”, MIS Quarterly, Vol. 33 No. 4, pp. 689-708.
Cheah, J.-H., Sarstedt, M., Ringle, C.M., Ramayah, T. and Ting, H. (2018), “Convergent validity assessment of formatively measured constructs in PLS-SEM: on using single-item versus multi-item measures in redundancy analyses”, International Journal of Contemporary Hospitality Management, Vol. 30 No. 11, pp. 3192-3210.
Chin, W.W. (1998), “The partial least squares approach to structural equation modeling”, in Marcoulides, G.A. (Ed.), Modern Methods for Business Research, Mahwah, Erlbaum, pp. 295-358.
Chin, W.W. (2003), PLS-Graph 3.0, Soft Modeling Inc, Houston.
Chin, W.W. (2010), “How to write up and report PLS analyses”, in Esposito Vinzi, V., Chin, W.W., Henseler, J., et al. (Eds). Handbook of Partial Least Squares: Concepts, Methods and Applications, Springer, Heidelberg, pp. 655-690.
Chin, W.W. and Dibbern, J. (2010), “A permutation based procedure for multi-group PLS analysis…”, in Esposito Vinzi, V. et al. (Eds), Handbook of Partial Least Squares, Springer, pp. 171-193.
Chou, C.-P., Bentler, P.M. and Satorra, A. (1991), “Scaled test statistics and robust standard errors for Non-Normal data…”, British Journal of Mathematical and Statistical Psychology, Vol. 44 No. 2, pp. 347-357.
Cochran, W.G. (1977), Sampling Techniques, Wiley, New York, NY.
Cohen, J. (1988), Statistical Power Analysis for the Behavioral Sciences, Lawrence Erlbaum Associates.
Danks, N. and Ray, S. (2018), “Predictions from partial least squares models”, in Ali, F. et al. (Eds), Applying Partial Least Squares in Tourism and Hospitality Research, Emerald, Bingley, pp. 35-52.
Diamantopoulos, A., Sarstedt, M., Fuchs, C., Wilczynski, P. and Kaiser, S. (2012), “Guidelines for choosing between multi-item and single-item scales…”, Journal of the Academy of Marketing Science, Vol. 40 No. 3, pp. 434-449.
Diamantopoulos, A. and Winklhofer, H.M. (2001), “Index construction with formative indicators…”, Journal of Marketing Research, Vol. 38 No. 2, pp. 269-277.
Dijkstra, T.K. and Henseler, J. (2015), “Consistent partial least squares path modeling”, MIS Quarterly, Vol. 39 No. 2, pp. 297-316.
do Valle, P.O. and Assaker, G. (2016), “Using partial least squares structural equation modeling in tourism research…”, Journal of Travel Research, Vol. 55 No. 6, pp. 695-708.
Dolce, P., Esposito Vinzi, V. and Lauro, C. (2017), “Predictive path modeling through PLS…”, in Latan, H. and Noonan, R. (Eds), Partial Least Squares Path Modeling, Springer, pp. 153-172.
Drolet, A.L. and Morrison, D.G. (2001), “Do we really need multiple-item measures in service research?”, Journal of Service Research, Vol. 3 No. 3, pp. 196-204.
Efron, B. (1987), “Better bootstrap confidence intervals”, Journal of the American Statistical Association, Vol. 82 No. 397, pp. 171-185.
Fornell, C.G. and Bookstein, F.L. (1982), “Two structural equation models: LISREL and PLS…”, Journal of Marketing Research, Vol. 19 No. 4, pp. 440-452.
Fornell, C.G. and Larcker, D.F. (1981), “Evaluating structural equation models with unobservable variables and measurement error”, Journal of Marketing Research, Vol. 18 No. 1, pp. 39-50.
Franke, G.R. and Sarstedt, M. (2019), “Heuristics versus statistics in discriminant validity testing…”, Internet Research, Forthcoming.
Garson, G.D. (2016), Partial Least Squares Regression and Structural Equation Models, Statistical Associates, Asheboro.
Geisser, S. (1974), “A predictive approach to the random effects model”, Biometrika, Vol. 61 No. 1, pp. 101-107.
Geweke, J. and Meese, R. (1981), “Estimating regression models of finite but unknown order”, International Economic Review, Vol. 22 No. 1, pp. 55-70.
Goodhue, D.L., Lewis, W. and Thompson, R. (2012), “Does PLS have advantages for small sample size or non-normal data?”, MIS Quarterly, Vol. 36 No. 3, pp. 981-1001.
Götz, O., Liehr-Gobbers, K. and Krafft, M. (2010), “Evaluation of structural equation models using the partial least squares (PLS) Approach”, in Handbook of Partial Least Squares, Springer, pp. 691-711.
Gudergan, S.P., Ringle, C.M., Wende, S. and Will, A. (2008), “Confirmatory tetrad analysis in PLS path modeling”, Journal of Business Research, Vol. 61 No. 12, pp. 1238-1249.
Hahn, C., Johnson, M.D., Herrmann, A. and Huber, F. (2002), “Capturing customer heterogeneity using a finite mixture PLS approach”, Schmalenbach Business Review, Vol. 54 No. 3, pp. 243-269.
Hair, J.F., Hult, G.T.M., Ringle, C.M. and Sarstedt, M. (2017a), A Primer on Partial Least Squares Structural Equation Modeling (PLS-SEM), Sage, Thousand Oaks, CA.
Hair, J.F., Hult, G.T.M., Ringle, C.M., Sarstedt, M. and Thiele, K.O. (2017b), “Mirror, Mirror on the wall…”, Journal of the Academy of Marketing Science, Vol. 45 No. 5, pp. 616-632.
Hair, J.F., Ringle, C.M. and Sarstedt, M. (2011), “PLS-SEM: indeed a silver bullet”, Journal of Marketing Theory and Practice, Vol. 19 No. 2, pp. 139-151.
Hair, J.F., Ringle, C.M. and Sarstedt, M. (2013), “Partial least squares structural equation modeling: rigorous applications, better results and higher acceptance”, Long Range Planning, Vol. 46 Nos 1/2, pp. 1-12.
Hair, J.F., Sarstedt, M., Hopkins, L. and Kuppelwieser, V.G. (2014), “Partial least squares structural equation modeling (PLS-SEM): an emerging tool in business research”, European Business Review, Vol. 26 No. 2, pp. 106-121.
Hair, J.F., Sarstedt, M., Matthews, L. and Ringle, C.M. (2016), “Identifying and treating unobserved heterogeneity with FIMIX-PLS: part I method”, European Business Review, Vol. 28 No. 1, pp. 63-76.
Hair, J.F., Sarstedt, M., Pieper, T.M. and Ringle, C.M. (2012a), “The use of partial least squares structural equation modeling in strategic management research…”, Long Range Planning, Vol. 45 Nos 5/6, pp. 320-340.
Hair, J.F., Sarstedt, M. and Ringle, C.M. (2019), “Rethinking some of the rethinking of partial least squares”, European Journal of Marketing, Forthcoming.
Hair, J.F., Sarstedt, M., Ringle, C.M. and Gudergan, S.P. (2018), Advanced Issues in Partial Least Squares Structural Equation Modeling (PLS-SEM), Sage, Thousand Oaks, CA.
Hair, J.F., Sarstedt, M., Ringle, C.M., et al. (2012b), “An assessment of the use of partial least squares structural equation modeling in marketing research”, Journal of the Academy of Marketing Science, Vol. 40 No. 3, pp. 414-433.
Henseler, J., Dijkstra, T.K., Sarstedt, M., et al. (2014), “Common beliefs and reality about partial least squares…”, Organizational Research Methods, Vol. 17 No. 2, pp. 182-209.
Henseler, J. and Fassott, G. (2010), “Testing moderating effects in PLS path models…”, in Handbook of Partial Least Squares, Springer, pp. 713-735.
Henseler, J., Hubona, G.S. and Ray, P.A. (2016a), “Using PLS path modeling in new technology research: Updated guidelines”, Industrial Management and Data Systems, Vol. 116 No. 1, pp. 1-19.
Henseler, J., Hubona, G.S. and Ray, P.A. (2017), “Partial least squares path modeling: updated guidelines”, in Partial Least Squares Structural Equation Modeling: Basic Concepts…, Springer, pp. 19-39.
Henseler, J., Ringle, C.M. and Sarstedt, M. (2015), “A new criterion for assessing discriminant validity in variance-based structural equation modeling”, Journal of the Academy of Marketing Science, Vol. 43 No. 1, pp. 115-135.
Henseler, J., Ringle, C.M. and Sarstedt, M. (2016b), “Testing measurement invariance of composites using partial least squares”, International Marketing Review, Vol. 33 No. 3, pp. 405-431.
Henseler, J., Ringle, C.M. and Sinkovics, R.R. (2009), “The use of partial least squares path modeling in international marketing”, Advances in International Marketing, Vol. 20, pp. 277-320.
Henseler, J. and Sarstedt, M. (2013), “Goodness-of-fit indices for partial least squares path modeling”, Computational Statistics, Vol. 28 No. 2, pp. 565-580.
Houston, M.B. (2004), “Assessing the validity of secondary data proxies for marketing constructs”, Journal of Business Research, Vol. 57 No. 2, pp. 154-161.
Hult, G.T.M., Hair, J.F., Proksch, D., Sarstedt, M., Pinkwart, A. and Ringle, C.M. (2018), “Addressing endogeneity in international marketing applications of partial least squares…”, Journal of International Marketing, Vol. 26 No. 3, pp. 1-21.
Ittner, C.D., Larcker, D.F. and Rajan, M.V. (1997), “The choice of performance measures in annual bonus contracts”, Accounting Review, Vol. 72 No. 2, pp. 231-255.
Jöreskog, K.G. (1971), “Simultaneous factor analysis in several populations”, Psychometrika, Vol. 36 No. 4, pp. 409-426.
Jöreskog, K.G. (1973), “A general method for estimating a linear structural equation system”, In: Structural Equation Models in the Social Sciences, pp. 255-284.
Kaufmann, L. and Gaeckler, J. (2015), “A structured review of partial least squares in supply chain management research”, Journal of Purchasing and Supply Management, Vol. 21 No. 4, pp. 259-272.
Khan, G.F., Sarstedt, M., Shiau, W.-L., Hair, J.F., Ringle, C.M. and Fritze, M. (2019), “Methodological research on partial least squares structural equation modeling (PLS-SEM)…”, Internet Research, Forthcoming.
Kock, N. and Hadaya, P. (2018), “Minimum sample size estimation in PLS-SEM…”, Information Systems Journal, Vol. 28 No. 1, pp. 227-261.
Latan, H. (2018), “PLS path modeling in hospitality and tourism research…”, in Applying Partial Least Squares in Tourism and Hospitality Research, Emerald, pp. 53-84.
Lohmöller, J.-B. (1989), Latent Variable Path Modeling with Partial Least Squares, Physica, Heidelberg.
Marcoulides, G.A. and Chin, W.W. (2013), “You write, but others read…”, in New Perspectives in Partial Least Squares and Related Methods, Springer, pp. 31-64.
Marcoulides, G.A., Chin, W.W. and Saunders, C. (2009), “Foreword: a critical look at partial least squares modeling”, MIS Quarterly, Vol. 33 No. 1, pp. 171-175.
Marcoulides, G.A., Chin, W.W. and Saunders, C. (2012), “When imprecise statistical statements become problematic…”, MIS Quarterly, Vol. 36 No. 3, pp. 717-728.
Marcoulides, G.A. and Saunders, C. (2006), “PLS: a silver bullet?”, MIS Quarterly, Vol. 30 No. 2, pp. iii-viii.
Mason, C.H. and Perreault, W.D. (1991), “Collinearity, power, and interpretation of multiple regression analysis”, Journal of Marketing Research, Vol. 28 No. 3, pp. 268-280.
Mateos-Aparicio, G. (2011), “Partial least squares (PLS) methods…”, Communications in Statistics Theory and Methods, Vol. 40 No. 13, pp. 2305-2317.
Matthews, L. (2017), “Applying multi-group analysis in PLS-SEM…”, in Partial Least Squares Structural Equation Modeling…, Springer, pp. 219-243.
Matthews, L., Sarstedt, M., Hair, J.F. and Ringle, C.M. (2016), “Identifying and treating unobserved heterogeneity with FIMIX-PLS: part II – a case study”, European Business Review, Vol. 28 No. 2, pp. 208-224.
Monecke, A. and Leisch, F. (2012), “semPLS: structural equation modeling using partial least squares”, Journal of Statistical Software, Vol. 48 No. 3, pp. 1-32.
Nitzl, C. (2016), “The use of partial least squares structural equation modelling (PLS-SEM) in management accounting research…”, Journal of Accounting Literature, Vol. 37, pp. 19-35.
Nitzl, C., Roldán, J.L. and Cepeda, C.G. (2016), “Mediation analysis in partial least squares path modeling…”, Industrial Management and Data Systems, Vol. 119 No. 9, pp. 1849-1864.
Olsson, U.H., Foss, T., Troye, S.V. and Howell, R.D. (2000), “The performance of ML, GLS, and WLS estimation…”, Structural Equation Modeling: A Multidisciplinary Journal, Vol. 7 No. 4, pp. 557-595.
Park, S. and Gupta, S. (2012), “Handling endogenous regressors by joint estimation using copulas”, Marketing Science, Vol. 31 No. 4, pp. 567-586.
Peng, D.X. and Lai, F. (2012), “Using partial least squares in operations management research…”, Journal of Operations Management, Vol. 30 No. 6, pp. 467-480.
Petter, S. (2018), “Haters gonna hate”: PLS and information systems research”, ACM SIGMIS Database, Vol. 49 No. 2, pp. 10-13.
Raithel, S., Sarstedt, M., Scharf, S. and Schwaiger, M. (2012), “On the value relevance of customer satisfaction…”, Journal of the Academy of Marketing Science, Vol. 40 No. 4, pp. 509-525.
Ramayah, T., Cheah, J.-H., Chuah, F., Ting, H. and Memon, M.A. (2016), Partial Least Squares Structural Equation Modeling (PLS-SEM) Using SmartPLS 3.0…, Pearson, Singapore.
Ramsey, J.B. (1969), “Tests for specification errors in classical linear least-squares regression analysis”, Journal of the Royal Statistical Society, Series B, Vol. 31 No. 2, pp. 350-371.
Rasoolimanesh, S.M. and Ali, F. (2018), “Editorial: partial least squares (PLS) in hospitality and tourism research”, Journal of Hospitality and Tourism Technology, Vol. 9 No. 3, pp. 238-248.
Reinartz, W.J., Haenlein, M. and Henseler, J. (2009), “An empirical comparison of the efficacy of covariance-based and variance-based SEM”, International Journal of Research in Marketing, Vol. 26 No. 4, pp. 332-344.
Richter, N.F., Cepeda Carrión, G., Roldán, J.L. and Ringle, C.M. (2016), “European management research using partial least squares structural equation modeling (PLS-SEM): editorial”, European Management Journal, Vol. 34 No. 6, pp. 589-597.
Richter, N.F., Sinkovics, R.R., Ringle, C.M. and Schlägel, C.M. (2015), “A critical look at the use of SEM in international business research”, International Marketing Review, Vol. 33 No. 3, pp. 376-404.
Rigdon, E.E. (2012), “Rethinking partial least squares path modeling: in praise of simple methods”, Long Range Planning, Vol. 45 Nos 5/6, pp. 341-358.
Rigdon, E.E. (2013), “Partial least squares path modeling”, in Structural Equation Modeling: A Second Course, pp. 81-116.
Rigdon, E.E. (2014a), “Comment on improper use of endogenous formative variables”, Journal of Business Research, Vol. 67 No. 1, pp. 2800-2802.
Rigdon, E.E. (2014b), “Rethinking partial least squares path modeling: breaking chains and forging ahead”, Long Range Planning, Vol. 47 No. 3, pp. 161-167.
Rigdon, E.E. (2016), “Choosing PLS path modeling as analytical method in european management research…”, European Management Journal, Vol. 34 No. 6, pp. 598-605.
Rigdon, E.E., Sarstedt, M. and Ringle, C.M. (2017), “On comparing results from CB-SEM and PLS-SEM…”, Marketing Zfp, Vol. 39 No. 3, pp. 4-16.
Ringle, C.M. and Sarstedt, M. (2016), “Gain more insight from your PLS-SEM results: the Importance-Performance map analysis”, Industrial Management and Data Systems, Vol. 116 No. 9, pp. 1865-1886.
Ringle, C.M., Sarstedt, M., Mitchell, R. and Gudergan, S.P. (2019), “Partial least squares structural equation modeling in HRM research”, The International Journal of Human Resource Management, Forthcoming.
Ringle, C.M., Sarstedt, M. and Mooi, E.A. (2010), “Response-based segmentation using finite mixture partial least squares…”, Annals of Information Systems, Vol. 8, pp. 19-49.
Ringle, C.M., Sarstedt, M. and Straub, D.W. (2012), “A critical look at the use of PLS-SEM in MIS quarterly”, MIS Quarterly, Vol. 36 No. 1, pp. iii-xiv.
Ringle, C.M., Wende, S. and Becker, J.-M. (2015), SmartPLS 3, SmartPLS, Bönningstedt.
Ringle, C.M., Wende, S. and Will, A. (2005), SmartPLS 2, SmartPLS, Hamburg.
Roldán, J.L. and Sánchez-Franco, M.J. (2012), “Variance-based structural equation modeling…”, in Research Methodologies, Innovations and Philosophies in Software Systems Engineering…, IGI Global, pp. 193-221.
Sarstedt, M. and Mooi, E.A. (2019), A Concise Guide to Market Research…, Springer, Heidelberg.
Sarstedt, M., Ringle, C.M. and Hair, J.F. (2017a), “Partial least squares structural equation modeling”, in Handbook of Market Research, Springer.
Sarstedt, M., Ringle, C.M. and Hair, J.F. (2017b), “Treating unobserved heterogeneity in PLS-SEM: a multi-method approach”, in Partial Least Squares Structural Equation Modeling…, Springer, pp. 197-217.
Sarstedt, M., Becker, J.-M., Ringle, C.M. and Schwaiger, M. (2011), “Uncovering and treating unobserved heterogeneity with FIMIX-PLS…”, Schmalenbach Business Review, Vol. 63 No. 1, pp. 34-62.
Sarstedt, M., Bengart, P., Shaltoni, A.M. and Lehmann, S. (2018), “The use of sampling methods in advertising research…”, International Journal of Advertising, Vol. 37 No. 4, pp. 650-663.
Sarstedt, M., Diamantopoulos, A., Salzberger, T. and Baumgartner, P. (2016a), “Selecting single items to measure doubly-concrete constructs…”, Journal of Business Research, Vol. 69 No. 8, pp. 3159-3167.
Sarstedt, M., Ringle, C.M., Henseler, J. and Hair, J.F. (2014), “On the emancipation of PLS-SEM: a commentary on Rigdon (2012)”, Long Range Planning, Vol. 47 No. 3, pp. 154-160.
Sarstedt, M., Hair, J.F., Ringle, C.M., Thiele, K.O. and Gudergan, S.P. (2016b), “Estimation issues with PLS and CBSEM: where the bias lies!”, Journal of Business Research, Vol. 69 No. 10, pp. 3998-4010.
Sarstedt, M., Ringle, C.M., Cheah, J.-H., Ting, H., Moisescu, O.I. and Radomir, L. (2019), “Structural model robustness checks in PLS-SEM”, Tourism Economics, Forthcoming.
Schwarz, G. (1978), “Estimating the dimensions of a model”, The Annals of Statistics, Vol. 6 No. 2, pp. 461-464.
Sharma, P.N., Sarstedt, M., Shmueli, G., Kim, K.H. and Thiele, K.O. (2019a), “PLS-Based model selection…”, Journal of the Association for Information Systems, Forthcoming.
Sharma, P.N., Shmueli, G., Sarstedt, M., Danks, S. and Ray, N. (2019b), “Prediction-oriented model selection in partial least squares path modeling”, Decision Sciences, Forthcoming.
Shiau, W.-L., Sarstedt, M. and Hair, J.F. (2019), “Editorial: internet research using Partial Least squares Structural equation modeling (PLS-SEM)”, Internet Research, Forthcoming.
Shmueli, G. (2010), “To explain or to predict?”, Statistical Science, Vol. 25 No. 3, pp. 289-310.
Shmueli, G. and Koppius, O.R. (2011), “Predictive analytics in information systems research”, MIS Quarterly, Vol. 35 No. 3, pp. 553-572.
Shmueli, G., Ray, S., Velasquez Estrada, J.M. and Shatla, S.B. (2016), “The elephant in the room: evaluating the predictive performance of PLS models”, Journal of Business Research, Vol. 69 No. 10, pp. 4552-4564.
Shmueli, G., Sarstedt, M., Hair, J.F., Cheah, J.-H., Ting, H., Vaithilingam, S. and Ringle, C.M. (2019), “Predictive model assessment in PLS-SEM: guidelines for using PLSpredict”, Working Paper.
Sosik, J.J., Kahai, S.S. and Piovoso, M.J. (2009), “Silver bullet or voodoo statistics?…”, Group and Organization Management, Vol. 34 No. 1, pp. 5-36.
Stone, M. (1974), “Cross-validatory choice and assessment of statistical predictions”, Journal of the Royal Statistical Society, Vol. 36 No. 2, pp. 111-147.
Svensson, G., Ferro, C., Høgevold, N., Padin, C., Sosa Varela, J.C. and Sarstedt, M. (2018), “Framing the triple bottom line approach…”, Journal of Cleaner Production, Vol. 197, pp. 972-991.
Tenenhaus, M., Esposito Vinzi, V., Chatelin, Y.-M. and Lauro, C. (2005), “PLS path modeling”, Computational Statistics and Data Analysis, Vol. 48 No. 1, pp. 159-205.
Voorhees, C.M., Brady, M.K., Calantone, R. and Ramirez, E. (2016), “Discriminant validity testing in marketing…”, Journal of the Academy of Marketing Science, Vol. 44 No. 1, pp. 119-134.
Westland, J.C. (2015), Partial least squares path analysis, Springer International Publishing, Cham, pp. 23-46.
Willaby, H.W., Costa, D.S.J., Burns, B.D., MacCann, C. and Roberts, R.D. (2015), “Testing complex models with small sample sizes…”, Personality and Individual Differences, Vol. 84, pp. 73-78.
Wold, H.O.A. (1975), “Path models with latent variables: The NIPALS approach”, in Quantitative Sociology…, Academic Press, pp. 307-357.
Wold, H.O.A. (1982), “Soft modeling: the basic design and some extensions”, in Systems under Indirect Observations: Part II, North-Holland, pp. 1-54.
Wold, H.O.A. (1985), “Partial least squares”, in Encyclopedia of Statistical Sciences, Wiley, pp. 581-591.
9. Lời kêu gọi hành động
Kiến thức về báo cáo kết quả PLS-SEM là yếu tố then chốt để mở cánh cửa công bố quốc tế. Đừng chỉ dừng lại ở việc đọc tóm tắt, hãy tải ngay tài liệu gốc để nghiên cứu từng chú thích và ví dụ minh họa của Giáo sư Hair.
Xem thêm
Hướng dẫn xây dựng lý thuyết từ Corley & Gioia (2011) (Building Theory About Theory Building)
Đóng góp lý thuyết trong Nghiên cứu Quản trị Xu hướng qua 5 Thập kỷ (Theoretical Contribution)
Các Lý thuyết tổ chức: Tiêu Chí Đánh Giá, Cấu Trúc và Nền Tảng Xây Dựng (Bacharach, 1989)
Giảng viên Nguyễn Thanh Phương là chuyên gia chuyên sâu về Nghiên cứu khoa học, Ứng dụng AI, Digital Marketing và Quản trị bản thân. Với kinh nghiệm giảng dạy thực chiến, tác giả trực tiếp hướng dẫn ứng dụng phương pháp luận và phân tích dữ liệu chuyên sâu cho người học nên được sinh viên gọi là Thầy giáo quốc dân. Mọi nội dung chia sẻ đều tuân thủ nguyên tắc khách quan, thực chứng và mang giá trị ứng dụng cao, hướng tới mục tiêu cốt lõi: “Làm bạn tốt hơn!